Average Life Expectancy in the U.S. (State, Gender & Causes)
Free Life Insurance Comparison
Compare Quotes From Top Companies and Save
Secured with SHA-256 Encryption
Jeffrey Johnson
Insurance Lawyer
Jeffrey Johnson is a legal writer with a focus on personal injury. He has worked on personal injury and sovereign immunity litigation in addition to experience in family, estate, and criminal law. He earned a J.D. from the University of Baltimore and has worked in legal offices and non-profits in Maryland, Texas, and North Carolina. He has also earned an MFA in screenwriting from Chapman Univer...
Insurance Lawyer
UPDATED: Nov 28, 2023
It’s all about you. We want to help you make the right life insurance coverage choices.
Advertiser Disclosure: We strive to help you make confident life insurance decisions. Comparison shopping should be easy. We are not affiliated with any one life insurance provider and cannot guarantee quotes from any single provider.
Our insurance industry partnerships don’t influence our content. Our opinions are our own. To compare quotes from many different life insurance companies please enter your ZIP code on this page to use the free quote tool. The more quotes you compare, the more chances to save.
Editorial Guidelines: We are a free online resource for anyone interested in learning more about life insurance. Our goal is to be an objective, third-party resource for everything life insurance-related. We update our site regularly, and all content is reviewed by life insurance experts.
UPDATED: Nov 28, 2023
It’s all about you. We want to help you make the right life insurance coverage choices.
Advertiser Disclosure: We strive to help you make confident life insurance decisions. Comparison shopping should be easy. We are not affiliated with any one life insurance provider and cannot guarantee quotes from any single provider.
Our insurance industry partnerships don’t influence our content. Our opinions are our own. To compare quotes from many different life insurance companies please enter your ZIP code on this page to use the free quote tool. The more quotes you compare, the more chances to save.
On This Page
Life expectancy in the U.S. has come a long way since the turn of the last century. In 1900, the average life expectance at birth was just 47.6 years for men, and 50.6 years for women.
In those days, just surviving to adolescence was an accomplishment. Childhood diseases ravaged entire communities. Children born in the early 1900s would have had to survive the Spanish Flu epidemic of 1918 to make it to adulthood.
Authors Note
The article you are about to read reviews a large portion of data on life expectancy from multiple authoritative sources. These sources include the Centers for Disease Control and Prevention (CDC) and Kaiser Family Foundation, to name a few. It’s important to know that a large amount of data on life expectancy only goes as far back as 2017-2018. As new data comes out, we will be sure to update the article.
Looking to compare life insurance rates for free? Enter your ZIP code to get multiple quotes.
How is life expectancy calculated?
Life expectancy is the average number of additional years the median individual can expect to live. It cannot be calculated precisely for any generational cohort that has members still alive, but we can make an educated guess by building a life table and applying past causes of mortality and rates to it.
Life expectancy can be calculated from any age, though the most common calculations made for life expectancy at birth, and life expectancy at age 65.
The life expectancy at birth calculation tends to be less useful because it is skewed by child mortality rates. Those who reach age 15 and have not been felled by a common childhood infectious disease historically can expect to live well past the life expectancy at birth number.
For example, life expectancy at birth for members of the late medieval English peerage was about 30 years. But if they survived the era’s high child mortality rates and made it to age 21, they had a life expectancy of another 43 years, for a total age of 64 years.
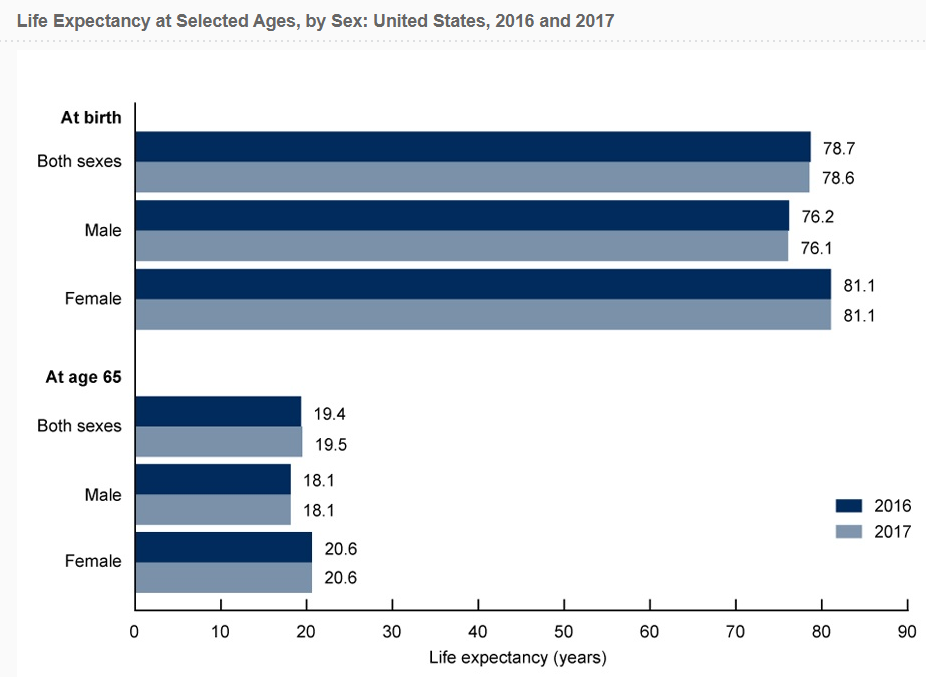
In the United States, the life expectancy for a woman born in 2018 is 81 years and one month, while a man born in the same year can expect to live an average of 76 years and two months, according to a January 2020 release from the National Center for Health Statistics.
The life expectancy for men and women at age 65 is 19.2 years across both genders. Men at age 65: have an average life expectancy of 18.1 years, and women at the same age have an average life expectancy of 20.7 years.
Your one-stop online guide for life insurance quotes. Get free quotes now!
Secured with SHA-256 Encryption
What is the average life expectancy by gender?
- Average Life Expectancy for U.S. Males at Birth = 76 years, 2 months
- Average Life Expectancy for U.S. Females at Birth = 81 years, 1 month
- Average Life Expectancy for U.S. Males at Age 65 = 18.1 years
- Average Life Expectancy for U.S. Females at Age 65 = 20.7 years
We are accustomed to women tending to outlive men by about five years. But in the United States, this has only been the case since 1880, when women’s average life spans reached 48, while men lived an average of 47.10 years. But today, the female life span advantage still holds around the entire world.
In prior generations, and in very poor countries, women frequently died as a result of complications of pregnancy and childbirth.
Today, maternal mortality rates in the United States are around 15 per 100,000 births. That’s a far cry from a century ago when the rate was over 600 per 100,000 births.
During the colonial period in America, the childbirth mortality rate was likely over 1200 per 100,000 births. Since women then had more children than they do today, as many as 1 in 20 women in early America died in childbirth.
Since 1900, and especially since the mid-20th century, life expectancy has been dramatically increased across the entire developed world. We are also seeing impressive improvements in life expectancy in places like China and India, with huge populations that have experienced a massive migration out of poverty over the last 50 years, along with the development of a meaningful middle class in both countries.
The advent of modern vaccines and antibiotics benefitted everyone, but especially women since they were historically more susceptible to death as a result of infectious diseases.
Furthermore, deaths due to alcoholic liver disease are 3.4 times higher for women than for men.
At the same time, men have historically been more likely to smoke, though tobacco usage has been declining sharply across the board, boosting life expectancy for men, especially.
In the United States, the gap between male and female life expectancy at age 45 peaked in 1975 at 6.24 years and has been narrowing since then.
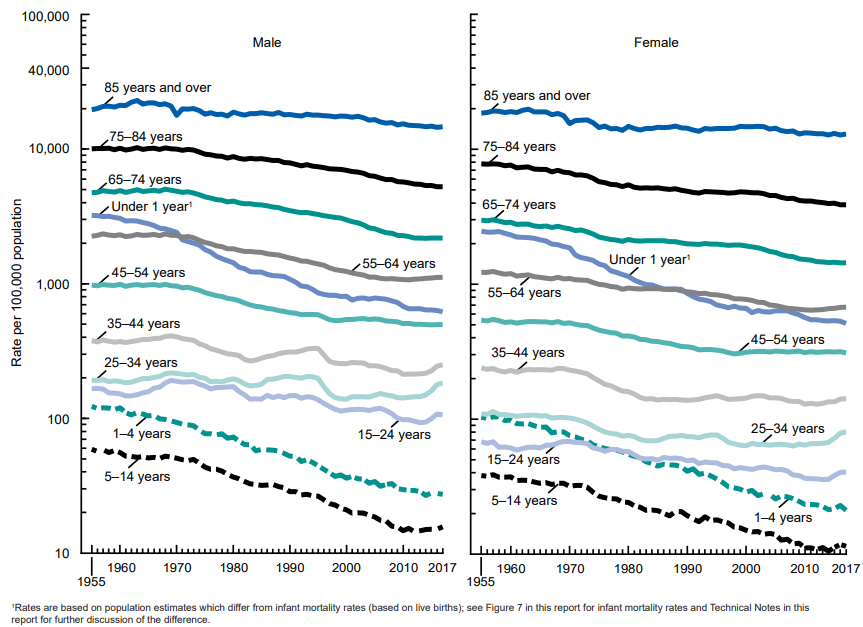
Death Rates by Age and Gender: 1955 through 2017
As this chart shows, most of the imprhttps://www.cdc.gov/nchs/data/nvsr/nvsr68/nvsr68_09-508.pdfovements in life expectancy have come from improvements in the mortality of younger age groups, and particularly in very young children.
The steepest slopes indicate the greatest improvements – meaning the most significant reduction in mortality.
The most vivid improvements in mortality rates have been among children less than 1-year-old, followed by the 1-to-4-year-old and 5-to-14-year-old groups.
In contrast, while they do show some improvement, the slopes for higher age groups are more gentle. Progress has not come as fast for older Americans.
The graph also shows that for some young adult age groups, there has been a recent, sharp uptick in mortality rates – particularly in men between 15 and 44. Younger women are also experiencing higher mortality rates.
This recent increase in mortality among younger people is mainly attributable to the opioid epidemic that continues to ravage the Midwest and much of the rest of the country, while the 55-plus demographic reaps the benefits of advances in cancer treatment and other medical technologies.
The last time we saw significant flatlining in mortality rates was during the AIDS epidemic in the 80s and 90s, which hit young men hard – particularly African-Americans. Prior to that, we saw significant increases in mortality in the 60s, particularly in men, as the cultural habit of smoking made its presence felt in lung cancer and other pulmonary disease rates.
Today, in 2020, we are benefiting from substantial progress in the early detection and treatment cancers, the 2nd most common cause of death for both men and women, according to the Center for Disease Control.
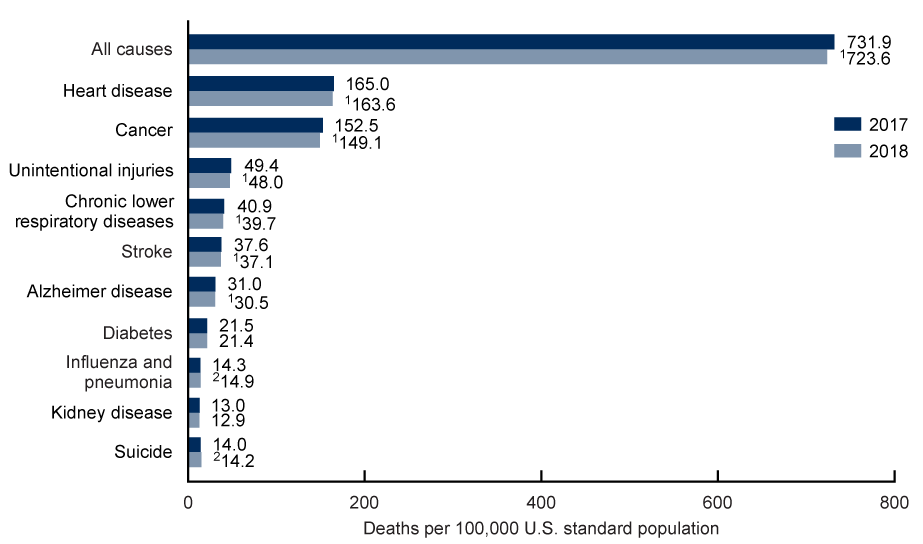
What were the top 15 leading causes of death in 2018 vs. 2017?
-
- Heart disease
- Cancers
- Accidents
- Chronic lower respiratory diseases
- Stroke
- Alzheimer’s disease
- Diabetes
- Influenza and pneumonia
- Kidney disease
- Suicide
- Chronic liver disease and cirrhosis
- Septicemia
- High blood pressure
- Parkinson’s disease
- Pneumonitis due to solids and liquids
The trend hasn’t been a straight line of improvement: According to the Centers for Disease Control, life expectancy at birth in the United States took a step backward in the early 80s, as the AIDS epidemic took the lives of thousands of young men, mostly, in the prime of their lives.
What effect has the opioid epidemic had on life expectancy?
Life expectancy in the U.S. declined again between 2014 and about 2017 – a decrease attributed to the opioid epidemic – a deadly social phenomenon that has taken the lives of over a half-million Americans since the late 90s.
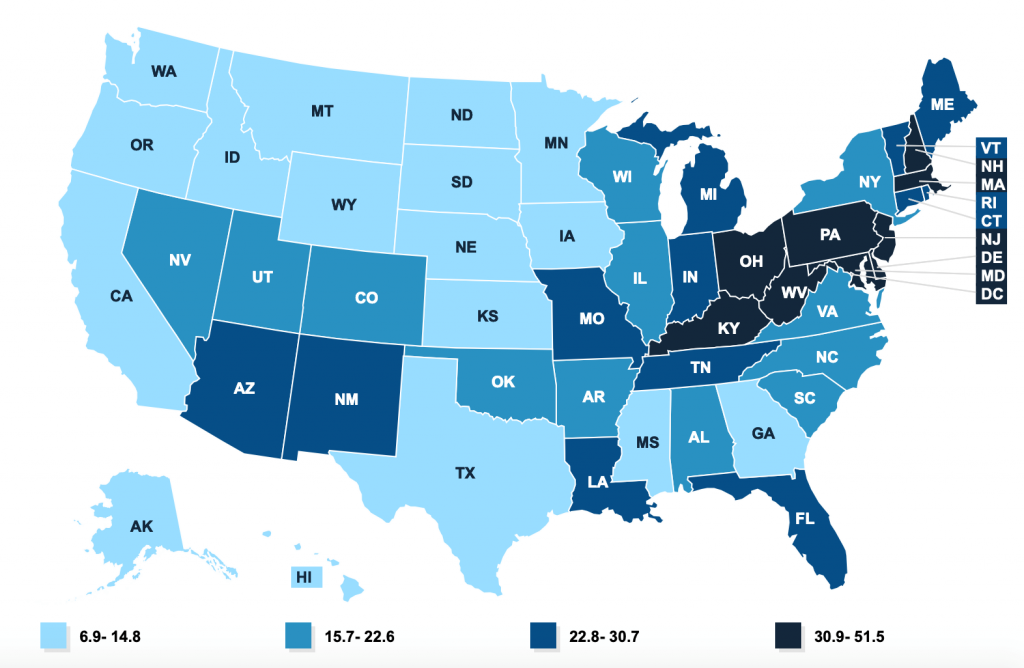
Drug Overdose Deaths per 100,000, by State (2018)
Source: Kaiser Family Foundation “Drug Overdose Death (per 100,000 population).”
GRAPHIC:
13.8: Number of overdose deaths per 100,000 in 2014
21.7: Number of overdose deaths per 100,000 in 2017, just three years later.
70,990: Number of drug overdose deaths in the U.S. in 2017.
20 States with the Highest Drug Overdose Deaths
| State | Drug Overdose Deaths |
|---|---|
| West Virginia | 51.5 |
| Delaware | 43.8 |
| Maryland | 37.2 |
| Pennsylvania | 36.1 |
| Ohio | 35.9 |
| New Hampshire | 35.8 |
| District of Columbia | 35.4 |
| New Jersey | 33.1 |
| Massachusetts | 32.8 |
| Kentucky | 30.9 |
| Connecticut | 30.7 |
| Rhode Island | 30.1 |
| Maine | 27.9 |
| Missouri | 27.5 |
| Tennessee | 27.5 |
| New Mexico | 26.7 |
| Michigan | 26.6 |
| Vermont | 26.6 |
| Indiana | 25.6 |
| Louisiana | 25.4 |
Your one-stop online guide for life insurance quotes. Get free quotes now!
Secured with SHA-256 Encryption
How does race relate to life expectancy in the country?
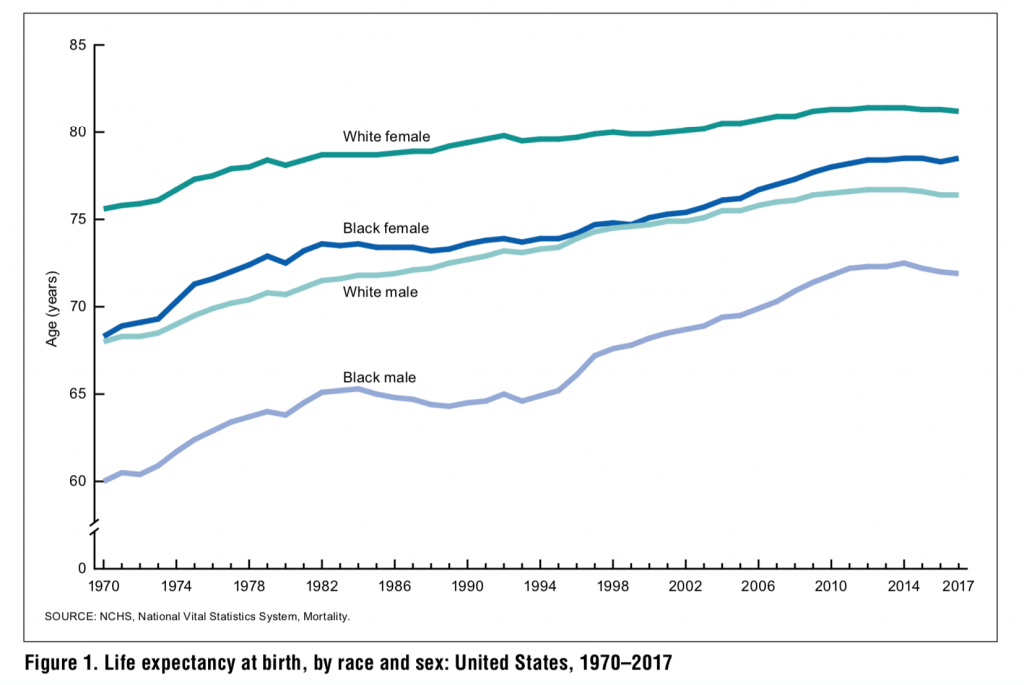
Life expectancy is historically closely correlated to race in the United States. African Americans have consistently lagged whites in life expectancy at birth. We mentioned above that life expectancy in 1900 nationwide, across all races, was 47.6 years for men, and 50.6 years for women. But that only tells part of the story:
At the turn of the 20th century, the life expectancy for non-whites (95 percent of whom were African-Americans) was much lower: Black males had a life expectancy at birth of just 32.5 years; black females had a life expectancy at birth of 33.5 years, according to data from the CDC.
The difference between whites and blacks narrowed substantially between 1900 and 1982. The life expectancy at birth figures rose for both groups, but the gap grew smaller – from 14.6 years in 1900 to 5.7 years in 1982.
But the gap widened again over the next decade to 7.1 years in 1993 – a difference the CDC attributes to increased mortality among black males due to HIV/AIDS and homicides.
What about neonatal, infant, and child mortality?
Neonatal, infant, and child mortality are accounted for separately since they have different direct causes. High rates are still closely correlated with poverty, race, and access to health care.
In 2017 – the last year for which up-to-date data from the CDC is available, a total of 22,335 deaths occurred in children prior to their first birthday – a rate of 5.79 per 1,000 live births. Males were 20% more likely to die before turning age one than females.
The neonatal mortality rate – the rate of death in the first 27 days of life – was 3.84 per 1,000 live births.
What were the 10 leading causes of infant death in 2017?
- Congenital deformation or malformation
- Low birthweight/short gestation
- Maternal complications
- Sudden infant death syndrome (SIDS)
- Accidents
- Cord and placental complications
- Bacterial sepsis
- Diseases of the circulatory system
- Respiratory distress of newborn
- Neonatal hemorrhage
What are the top 10 causes of death in the country?
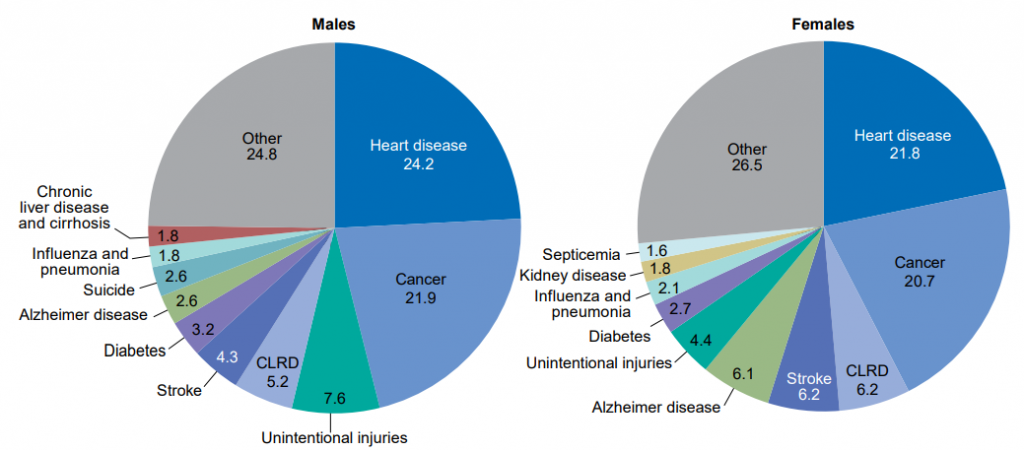
Heart disease was the number one killer for both men and women in 2017, accounting for nearly 1 in 4 deaths among men, and 1 in 5 deaths among women.
Men are much more likely to die in accidents than women – 7.6%, compared to 4.4% for women.
Women are more likely to die of Alzheimer’s disease (6.1% of deaths among women, compared to just 2.6% of deaths for men) and strokes (6.2% compared to 4.3%).
Men are significantly more likely than women to die by suicide: 2.6% of men who died in 2017 died as a result of taking their own lives. It wasn’t even among the top ten causes of death for women.
| Cause of Death | Number of Deaths (2016) | Number of Deaths (2017) |
|---|---|---|
| Heart Disease | 635,260 | 647,457 |
| Cancer | 598,038 | 599,108 |
| Accidents (Unintentional Injuries) | 161,374 | 169,936 |
| Chronic Lower Respiratory Diseases | 154,596 | 160,201 |
| Stroke (Cerebrovascular Diseases) | 142,142 | 146,383 |
| Alzheimer’s Disease | 116,103 | 121,404 |
| Diabetes | 80,058 | 83,564 |
| Influenza and Pneumonia | 51,537 | 55,672 |
| Nephritis, Nephrotic Syndrome and Nephrosis | 50,046 | 50,633 |
| Intentional Self-harm (Suicide) | 44,965 | 47,173 |
Your one-stop online guide for life insurance quotes. Get free quotes now!
Secured with SHA-256 Encryption
What are the top 10 causes of death by gender?
What are the top 10 causes of accidental ceath?
Accidents kill more people age 44 and below than disease. Among Americans ages 10-24 years of age, unintentional injuries account for four deaths out of every ten. They account for a third of all deaths between ages 25 and 44, making accidental death the leading cause of death by a significant margin.
After age 44, accidental death rates fall off sharply, to just 8.8 percent of the population. From age 45 to age 64, cancer takes over as the leading cause of death, followed by heart disease. And from age 65 through and up, heart disease is the top killer, claiming the lives of Americans.
According to the Insurance Information Institute, the top ten causes of accidental death across the entire U.S. population break down as follows:
| Cause of Death | Total Deaths (2018) | 1-year Probability of Death (1 in X) | Lifetime Probability of Death (1 in X) |
|---|---|---|---|
| Accidental poisoning by and exposure to noxious substances | 62,399 | 5,243 | 67 |
| Drug poisoning | 58,908 | 5,554 | 71 |
| Opioids (Including both legal and illegal) | 42,518 | 7,695 | 98 |
| All motor vehicle accidents | 39,404 | 8,303 | 106 |
| Car Occupants | 6,837 | 47,852 | 608 |
| Pedestrians | 7,680 | 42,600 | 541 |
| Motorcycle riders | 4,669 | 70,072 | 890 |
| Assault by firearm | 13,958 | 23,439 | 298 |
| Exposure to smoke, fire, and flames | 2,972 | 110,083 | 1,399 |
| Fall on and from stairs and steps | 2,509 | 130,398 | 1,657 |
| Drowning and submersion while in or falling into swimming pool | 746 | 438,562 | 5,573 |
| Fall on and from ladder or scaffolding | 485 | 674,572 | 8,571 |
| Firearms discharge (Accidental) | 458 | 714,339 | 9,077 |
| Air and space transport accidents | 372 | 879,482 | 11,175 |
| Cataclysmic storm (3) | 76 | 4,304,835 | 54,699 |
| Flood | 44 | 7,435,624 | 94,481 |
| Bitten or struck by dog | 35 | 9,347,641 | 118,776 |
| Earthquake and other earth movements | 26 | 12,853,363 | 159,890 |
| Lightning | 23 | 14,224,671 | 180,746 |
- As of 2018, the odds of dying from an unintentional injury were 1 in 1,334.
- The lifetime odds of death via accident/unintentional injury for a person born in 2018 are 1 in 17.
- The odds of dying from a drug poisoning of any kind in 2018 were 1 in 5,554.
- The lifetime odds of dying from a drug poisoning of any kind for an individual born in 2018 were 1 in 71.
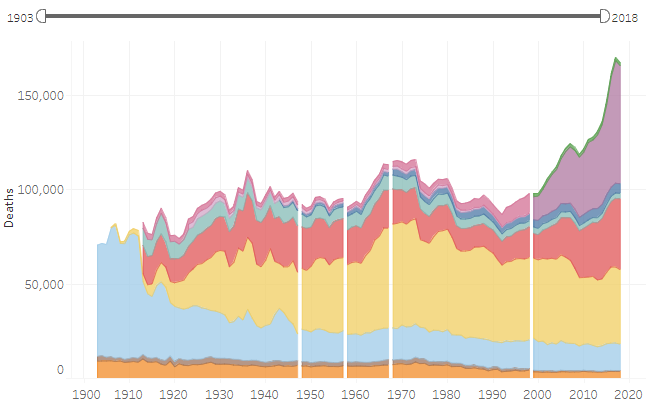
Since 1903, the chances of losing one’s life due to an accidental injury have fallen substantially. But the recent increase in the number of deaths due to poisoning, to include opiate and fentanyl overdoses, is readily apparent in the below graph:
* Line breaks in the above graph indicate that data are not comparable to previous years due to classification changes made in the International Classification of Diseases in 1948, 1958, 1968, and 1999.
The death rate from falls has increased as well, as more people are living further and further into old age, surviving other causes of death while becoming frailer.
The graph also shows a period of substantially increasing death rates between 1961 and 1973. This period was marked by an increase in motor accidents. The death rate per 100,000 due to motor accidents increased 26% over that period of time.
However, there was a sustained period of improvement between 1973 and 1992, over which the deaths fell by a third, and death rates fell by 38%. The National Safety Council attributes this improvement to a nationwide push to compel car manufacturers to install more and better vehicular safety equipment and features.
How do influenza and pneumonia relate to life expectancy?
According to the CDC, influenza causes between 9 million and 45 million illnesses each year, resulting in 140,000 to 810,000 hospitalizations and between 12,000 and 61,000 deaths each year. Women are somewhat more likely to succumb to the flu or to pneumonia.
Flu severity varies widely from year to year due to several factors, including the particular flu strain that becomes most prevalent and the effectiveness of the vaccine. The vaccine is less effective in some years than in others. However, even if the vaccine does not entirely prevent infection, the CDC believes that the vaccine helps to reduce the severity of the disease.
African-Americans and Hispanics are less likely than the general population to get a flu vaccine. African-Americans are also more likely to have preexisting conditions such as hypertension and diabetes that increase flu mortality rates.
The same goes for the two types of pneumonia vaccines: According to the American Lung Association, 62% of whites receive a pneumonia shot, compared to 47% of blacks and 42% of Hispanics. Pneumonia is a frequent and lethal complication of the influenza virus.
However, Hispanics tend to have a lower overall mortality rate (deaths per 100,000) than either blacks or whites – possibly due in part to a younger population.
Your one-stop online guide for life insurance quotes. Get free quotes now!
Secured with SHA-256 Encryption
What role does smoking play in life expectancy?
Put down the cigs. We know it’s hard. Dying of lung cancer, emphysema, throat, or mouth cancer is harder.
One out of every four heavy smokers (20 cigarettes a day or more) never makes it to age 65. Heavy smokers are twice as likely to die before reaching the age of 65 as moderate smokers (less than 20 cigarettes per day), and more than three times as likely as non-smokers, according to a recent study in Holland. On average, heavy smoking reduces life expectancy by about 13 years.
But quitting pays off, even much later in life. Surveyors found that those who quit before age 35 had the same life expectancy as people who had never smoked, while those who quit around age 50 cut their risk of premature death by about half.
Another study found that among 70-year-old men, the average life expectancy 70 was about 18 years in men who had never regularly smoked, 16 years for men who gave up smoking before age 70 but only about 14 years in men still smoking at age 70. Two-thirds of never smokers (65 percent), but only half of the current smokers (48%), survived from age 70 to age 85.
Average life expectancy for men at age 70
- Who have never regularly smoked: 18 years
- Who smoked but gave it up by age 70: 16 years
- Who are still smoking: 14 years
Odds of a 70-year old reaching age 85
- Never smoked: 65%
- Current smokers: 48%
Source: Science Daily “Smokers Who Survive to 70 Still Lose Four Years of Life.”
How has COVID-19 affected mortality rates and life expectancy?
As of this writing in April of 2020, it is too early to tell how the COVID-19 virus will rank as a cause of death for this year outstripping both heart disease and cancer as the leading daily cause of death.
The vast majority of those killed by the COVID-19 virus were over age 65 and had one or more pre-existing health problems, such as diabetes or high blood pressure, which made them more susceptible to the virus.
Indirect effects of COVID-19
The COVID-19 virus is also likely to cause an indirect increase in death rates, too. There are several reasons:
- Delayed health care. With non-elective surgeries canceled in most areas, and patients being reluctant to go to doctors’ offices and hospitals, patients are putting off needed surgeries, chemotherapy, radiology, and other treatments.
- Missed immunizations. By some estimates, almost 80% of young children are falling behind on their immunization and vaccination schedules. We may see an increase in child mortality rates due to infectious diseases such as measles and meningitis that are normally controlled by vaccination.
- Economic dislocation. Millions have been severely economically affected by layoffs, furloughs, and business closures. Many will lose their health insurance and are more likely to put off needed medical treatment.
These second-order effects of the 2020 pandemic are difficult to quantify, and will not be known for some time.
For the latest news on COVID-19 mortality and morbidity, see the Centers for Disease Control page here.
How does diabetes affect life expectancy?
An early diagnosis of Type 1 diabetes – that is insulin-dependent diabetes, where the pancreas stops producing insulin – also significantly affects life expectancy for both men and women.
On average, men diagnosed with Type 1 diabetes before the age of ten years have life expectancies that are 14 years shorter than non-diabetics, while women have life expectancies that are 18 years shorter than non-diabetics, according to a study published in The Lancet.
Type 1 diabetes is also killing large numbers of people even younger than 50, due to hypoglycemic comas and ketoacidosis.
For women, the heart attack risk of those diagnosed before age ten is 90 times greater than for non-diabetic women.
Among those diagnosed between ages 26 and 30, the average reduction in life expectancy for Type 1 diabetes is ten years.
Type 2 diabetes also reduces life expectancy for both men and women, though the impact of type 2 diabetes can vary widely based on how effectively the individual with diabetes manages to control his or her glucose levels over time.
Risk factors that reduce life expectancy for diabetics include:
- Obesity – particularly where there is a great deal of fat in the abdomen
- A diet that is high in sugar, salt and fat, and low in fiber
- Smoking
- A sedentary lifestyle/lack of exercise
- Lack of sleep
- Stress
Your one-stop online guide for life insurance quotes. Get free quotes now!
Secured with SHA-256 Encryption
How does cancer affect life expectancy?
Because different cancers are typically diagnosed at very different ages, their effect on mortality is typically measured as a five-year survival rate. That is, what are the chances an individual with a specific cancer diagnosis will still be alive five years after diagnosis?
However, a recent study has found that childhood cancer survivors age much faster and have significantly shorter lifespans, on average, than those who have never had cancer. Cancer survivors are also more likely to develop heart disease, lung scarring, frailty, and secondary cancers. They get diagnosed with age-associated diseases sooner than non-cancer survivors as well.
What is the average life expectancy at birth by state?
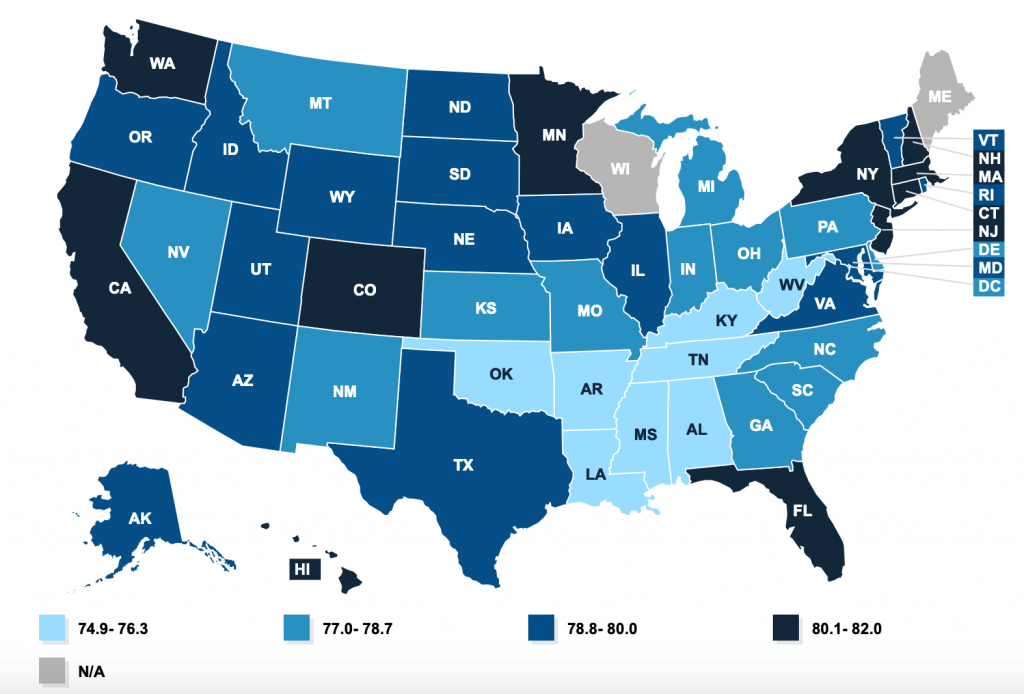
There are clear regional variations in life expectancy in the United States.
- People in coastal regions tend to live longer than people in inland regions.
- People in northern states tend to live longer than people in southern states.
Source: Kaiser Family Foundation “Life Expectancy at Birth (2010-2015).”
- Highest state life expectancy: Hawaii (82)
- Lowest state life expectancy: Mississippi (74.9)
Data is not available for Wisconsin and Maine.
What are the top 10 U.S. states with highest life expectancy at birth?
| Rank | State | Life Expectancy Age |
|---|---|---|
| #1. | Hawaii | 82.0 |
| #2. | California | 81.3 |
| #3. | Minnesota | 81.0 |
| #4. | New York | 81.0 |
| #5. | Connecticut | 80.9 |
| #6. | Massachusetts | 80.7 |
| #7. | Colorado | 80.5 |
| #8. | New Jersey | 80.5 |
| #9. | Washington | 80.3 |
| #10. | Florida | 80.1 |
What are the top 10 U.S. states with lowest life expectancy at birth?
| Rank | State | Life Expectancy Age |
|---|---|---|
| #1. | Mississippi | 74.9 |
| #2. | West Virginia | 75.3 |
| #3. | Alabama | 75.5 |
| #4. | Oklahoma | 75.8 |
| #5. | Kentucky | 75.9 |
| #6. | Arkansas | 76.0 |
| #7. | Louisiana | 76.0 |
| #8. | Tennessee | 76.3 |
| #9. | South Carolina | 77.0 |
| #10. | Indiana | 77.4 |
Urbanites Outliving Rural Americans
A recent study published in the Journals of Gerontology found that recent gains in longevity were concentrated in large metro areas and suburbs. Those in non-metro and small metro areas with less access to care and perhaps different diets and other factors tend to lag behind.
People on the West Coast also tend to outlive those in the interior. Gains in longevity also concentrated in the Pacific, New England, Mid-Atlantic, and South Atlantic regions, according to researchers. The East South Central and Appalachian regions did not perform nearly as well.
Life Expectancy Improvements in the U.S.
However, life expectancy at birth has now improved for the last two years, mainly due to lower rates of lung cancer (many smokers have already died), and improved screening, detection, and treatment for many other forms of cancer.
Projections in U.S. Life Expectancy at Birth on the Rise
| Year | Life Expectancy at Birth (Unisex) | Projected Increase from Prior Year |
|---|---|---|
| 2025 | 80.75 | +0.18% |
| 2024 | 80.60 | +0.18% |
| 2023 | 80.45 | +0.18% |
| 2022 | 80.30 | +0.18% |
| 2021 | 80.15 | +0.18% |
| 2020 | 80.00 | +0.18% |
| 2019 | 79.84 | +0.08% |
| 2018 | 79.69 | +0.18% |
| 2017 | 79.54 | +0.18% |
| 2016 | 79.39 | +0.18% |
| 2015 | 79.24 | – |
Source: Our World In Data “Projections of Life Expectancy (2015-2025).”
Your one-stop online guide for life insurance quotes. Get free quotes now!
Secured with SHA-256 Encryption
How are life expectancy and income related?
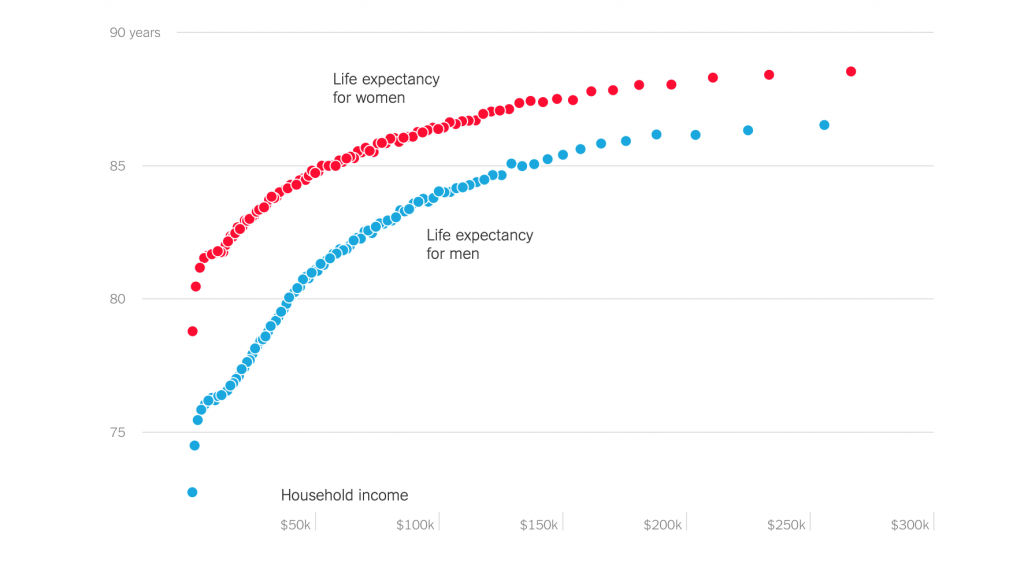
Income and life expectancy are highly correlated – up to a point. At lower income levels, increasing per capita income has a tremendous effect on longevity.
Once a country achieves a certain level of economic development and per capita income, additional income has less effect on life expectancy: A phenomenon that statisticians call the Preston Curve, named after a 1975 paper by Samuel H. Preston.
The income benefit flattens out after a certain point.
Source: Journal of Economic Perspectives
Preston’s work continues to be born out today, as this New York Times graphic shows:
Life expectancy has mostly been increasing around the world at all income levels, however, thanks to developments and improvements in vaccination, hydration therapy, antibiotics, education, and nutrition.
While overall health care costs in the United States are very high, advances in medical science continue to benefit even the poorest Americans and those around the world, as economies of scale allow technologies and drugs to become more widely and cheaply available.
Preston found that improved technology accounts for about 75 to 90% of global longevity improvements in the 1990s and 2000s. Per capita growth accounts for the rest.
Nevertheless, the correlation between income and life expectancy is still meaningful, and not just on an international scale. It’s also significant within the United States as well.
But behavioral factors that contribute to lower longevity also track closely to income as well: In the United States, lower-income people are more likely to smoke, consume unhealthy foods, or give birth at younger ages.
The study published in the Journal of the American Medical Association that formed the basis for the New York Times graphic above found that low life expectancies for lower-income people are not correlated with access or lack of access to health care.
However, it is strongly negatively correlated with smoking and positively correlated with the local area fraction of immigrants (r = 0.72, P < .001), the fraction of college graduates (r = 0.42, P < .001), and the level of government expenditures (r = 0.57, P < .001).
Are life expectancy and location in the U.S. relative?
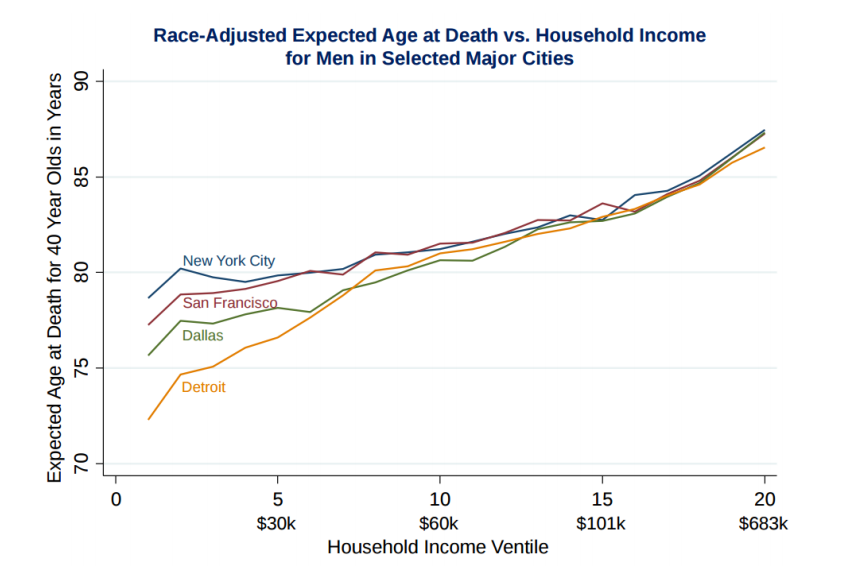
Location is another important factor in life expectancy among adults, especially at lower income levels. For men who make less than $50,000 per year at age 40, the city they live in has a significant effect on how many more years they can expect to live.
Where Do Low-Income Americans Live The Longest?
| Men | |
|---|---|
| City | Life Expectancy |
| New York, NY | 79.5 |
| San Jose, CA | 79.5 |
| Santa Barbara, CA | 79.4 |
| Santa Rosa, CA | 79.0 |
| Los Angeles, CA | 79.0 |
| San Diego, CA | 78.8 |
| Miami, FL | 78.3 |
| Newark, NJ | 78.2 |
| Boston, MA | 78.1 |
| Women | |
|---|---|
| City | Life Expectancy |
| Miami, FL | 84.2 |
| New York, NY | 84.0 |
| Santa Barbara, CA | 84.0 |
| San Jose, CA | 83.7 |
| San Diego, CA | 83.4 |
| Port St. Lucie, FL | 83.3 |
| Newark, NJ | 83.2 |
| Los Angeles, CA | 83.2 |
| Portland, ME | 83.1 |
| Providence, RI | 83.1 |
Where Do Low-Income Americans Live The Shortest?
| Men | |
|---|---|
| City | Life Expectancy |
| Gary, IN | 74.2 |
| Indianapolis, IN | 74.6 |
| Detroit, MI | 74.8 |
| Louisville, KY | 74.9 |
| Tulsa, OK | 74.9 |
| Toledo, OH | 74.9 |
| Oklahoma City, OK | 75.0 |
| Dayton, OH | 75.1 |
| Knoxville, TN | 75.1 |
| Las Vegas, NV | 75.1 |
| Women | |
|---|---|
| City | Life Expectancy |
| Las Vegas, NV | 80 |
| Oklahoma City, OK | 80.2 |
| Tulsa, OK | 80.3 |
| Honolulu, HI | 80.3 |
| Detroit, MI | 80.5 |
| Cincinnati, OH | 80.5 |
| Indianapolis, IN | 80.6 |
| Des Moines, IA | 80.6 |
| Gary, IN | 80.7 |
| Little Rock, AR | 80.7 |
Why is life expectancy at 65 important?
While life expectancy at birth is perhaps the most widely-cited metric, the average life expectancy at 65 is a much more important factor when it comes to both individual financial planning and many fields of policymaking.
After all, while life expectancy at birth is a vital measure of overall public health, most people are more concerned with more practical and immediate questions. For example:
- How many years must their retirement savings support them?
- How many years must their pension expect to pay out an income?
- How long will they be collecting Social Security benefits?
For example, having a rough idea of one’s life expectancy at age 65 can inform the decision whether to take Social Security benefits early, or wait until full retirement age before electing to begin receiving Social Security benefits.
Each additional year you wait generally translates into an 8% higher monthly benefit. Medically-adjusted life expectancy at age 65 is a vital component in deciding whether to take early benefits.
Life expectancy at age 65 is an essential factor in all these decisions and more. Consider:
- Today’s average 65-year-old man can expect to live until age 84.
- Today’s average 65-year-old woman can expect to live until age 86.5.
- 1 in 3: The chance of any given 65-year-old living past age 90.
- 1 in 7: The chance of any given 65-year old living past age 95.
Understanding longevity data is also crucial for life insurance planning: According to the Center for Retirement Research, a woman currently aged 62 has a 1 in 5 chance of losing her husband by age 75 and a 33 chance of losing her spouse by age 85.
Your one-stop online guide for life insurance quotes. Get free quotes now!
Secured with SHA-256 Encryption
What is joint life expectancy?
Joint life expectancy is an essential factor in personal financial planning. It is the median expected longevity of the second of two people – typically a married couple – to die.
All other things being equal, a joint life expectancy is always longer than either spouse’s single life expectancy, taken alone. Further, if one partner is much younger than the other, the joint life expectancy will be that much longer.
Pension managers, actuaries, as well as life insurance and investment professionals use this information to estimate how long a pool of money will have to last a couple entering retirement, or to calculate how much income an annuity can pay out each month, or each year. And individuals have to make the same calculation.
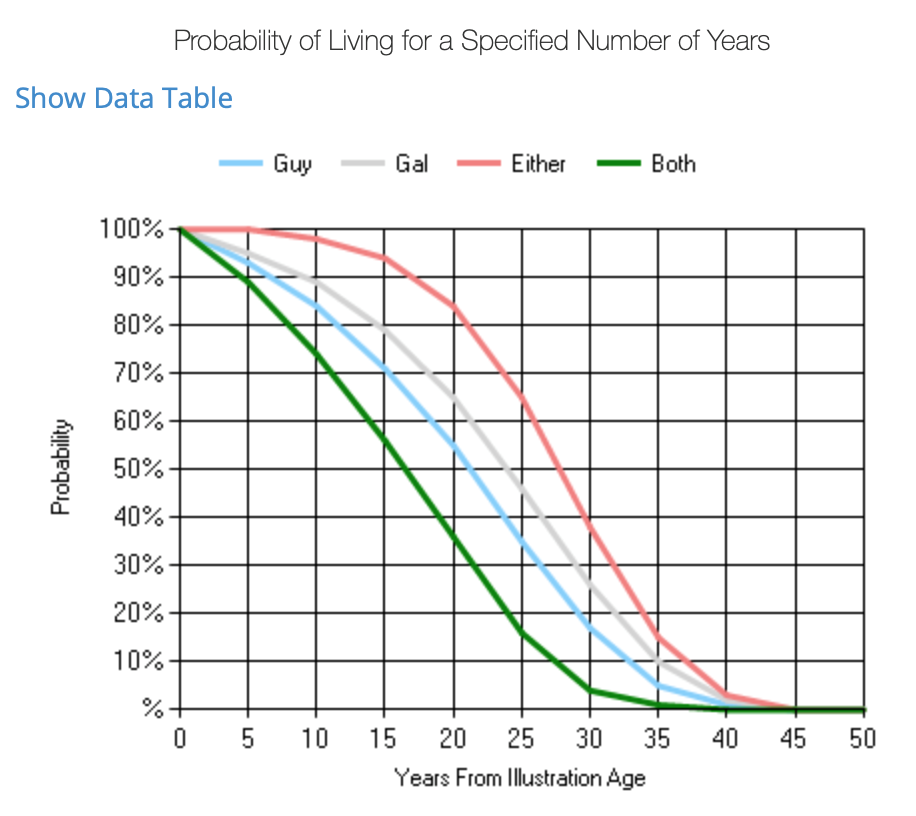
Take a simple example of a married couple in average health turning age 65 today. According to the American Society of Actuaries:
- Chances are greater than 80% at least one of them will live to age 85.
- Chances are about 40% at least one of them will live to age 90.
- In about 15% of cases, at least one of them will live to age 100.
In other words, a retirement nest egg has to last a lot longer than most people imagine.
If both halves of the couple are in “excellent” health, then their joint life expectancy is substantially higher:
- There is a 90% chance at least one of them will live to age 85.
- There is a 50% chance at least one of them will live to age 95.
- There is a 20% chance at least one of them will live to age 100.
You can run your own joint life expectancy probability by keying in your information at www.longevityillustrator.org.
What have been the long-term trends in age 65 life expectancy?
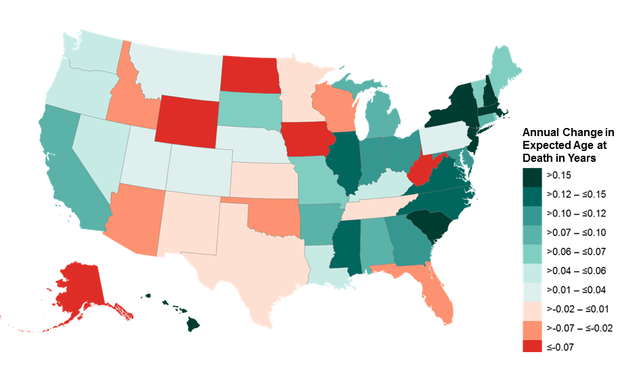
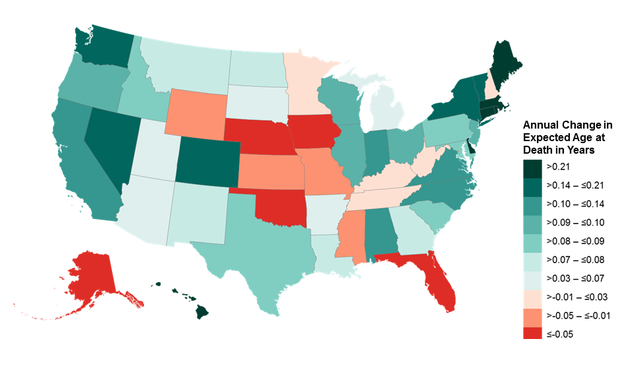
While the overall changes in life expectancy over the past 20 years have been positive, they have also been uneven. Longevity in most states has been increasing, while life expectancy in other states is flat or even declining for lower-income people, especially – and not just over short periods of time like two or three years.
The following graphics depict the changes in expected age at death for men and women in the lowest income quartiles over a 15-year period:
Men
Women
So coastal and northern states have generally been outperforming heartland and southern states – with a few exceptions.
What can we see looking forward?
According to Stanford researcher Shripad Tuljapurkar, life expectancy among 65-year-olds tends to increase by about three years for every generation – roughly tracking to the global decline in poverty over the same period. What’s more, life spans for those who have reached the age of 65 are increasing without regard to socioeconomic factors, Stanford researchers found.
“The data shows that we can expect longer lives and there’s no sign of a slowdown in this trend,” said Tuljapurkar, professor of biology, and Morrison Professor of Population Studies at Stanford University. “There’s not a limit to life that we can see, so what we can say for sure is that it’s not close enough that we can see the effect.”
Because medical science, nutritional science, transportation, and access to health care generally continue to improve, the actual recorded lifespans are almost certain to exceed current life expectancy tables. Life expectancy is a backward-looking indicator. We continue to develop new technologies that will affect American lifespans that are not yet reflected in the life expectancy tables.
As a result, most people entering their retirement years should err on the conservative side: Your retirement savings will very likely have to last you a few years longer than the life expectancy tables suggest.
Ready to Compare Life Insurance Rates?
It’s free, fast, and super simple.
Looking to compare life insurance rates for free? Enter your ZIP code to get multiple quotes.

Your one-stop online guide for life insurance quotes. Get free quotes now!
Secured with SHA-256 Encryption
Jeffrey Johnson
Insurance Lawyer
Jeffrey Johnson is a legal writer with a focus on personal injury. He has worked on personal injury and sovereign immunity litigation in addition to experience in family, estate, and criminal law. He earned a J.D. from the University of Baltimore and has worked in legal offices and non-profits in Maryland, Texas, and North Carolina. He has also earned an MFA in screenwriting from Chapman Univer...
Insurance Lawyer
Editorial Guidelines: We are a free online resource for anyone interested in learning more about life insurance. Our goal is to be an objective, third-party resource for everything life insurance-related. We update our site regularly, and all content is reviewed by life insurance experts.


